More from Upper Park in the Fog

There have been a lot of dense fog advisories in the northern California valley recently, which is quite typical for this time of year. It can make for some great sunrises if you can get just a little bit of elevation.

Untitled

I also ran by some deer that were having a lovely breakfast stroll on Upper Trail.

Untitled

This was all on my standard weekend long run.

Run for Food 2021

Run for Food was back on this year. It certainly wasn't up to the same level of participation that it has had in the past, but it was a good showing. I opted for a chipped time even though I haven't been doing anything that would suggest I would have a fast time. I did manage a 7:49min/mile page, which I guess for not going in with a goal is a fine after the fact one. Total time was 00:24:13, 7th in my age group and 96th overall (race results).

My at the starting line

My race nemesis, Ben Bailey, caught up to me with about half a mile to go. He then proceeded to pull away and there wasn't a damn thing I could do. I was going as fast as I could go and there was nothing in the tank.

Myself and Ben Bailey at the finish line, exhausted

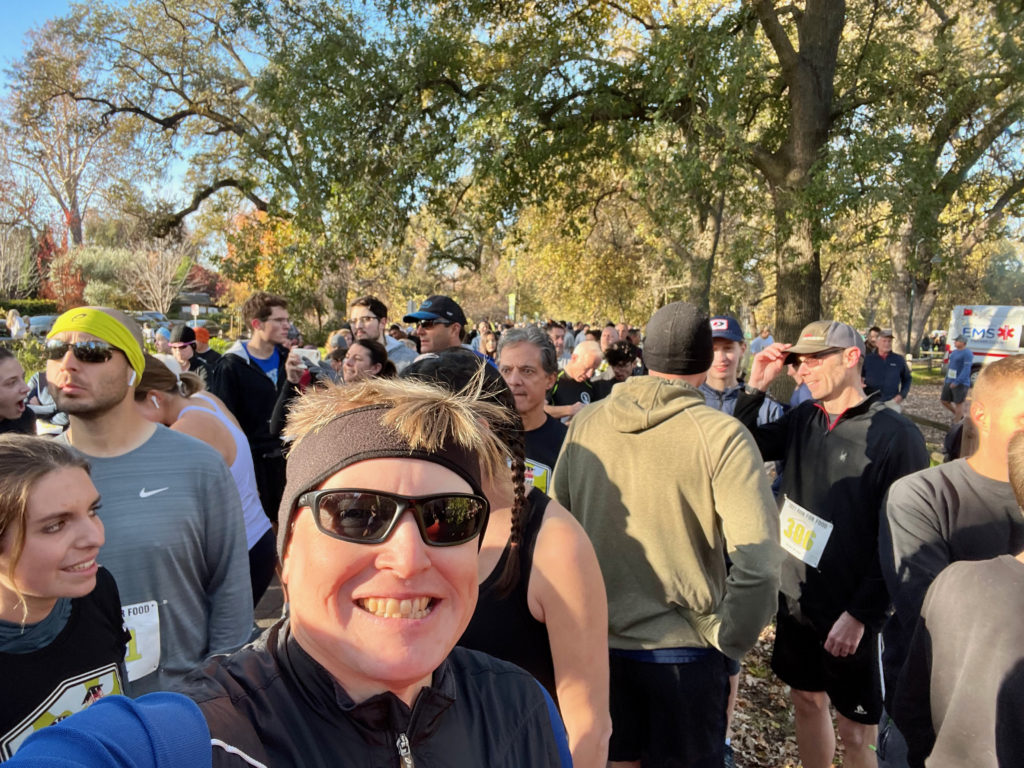
What ruggedly handsome runners!

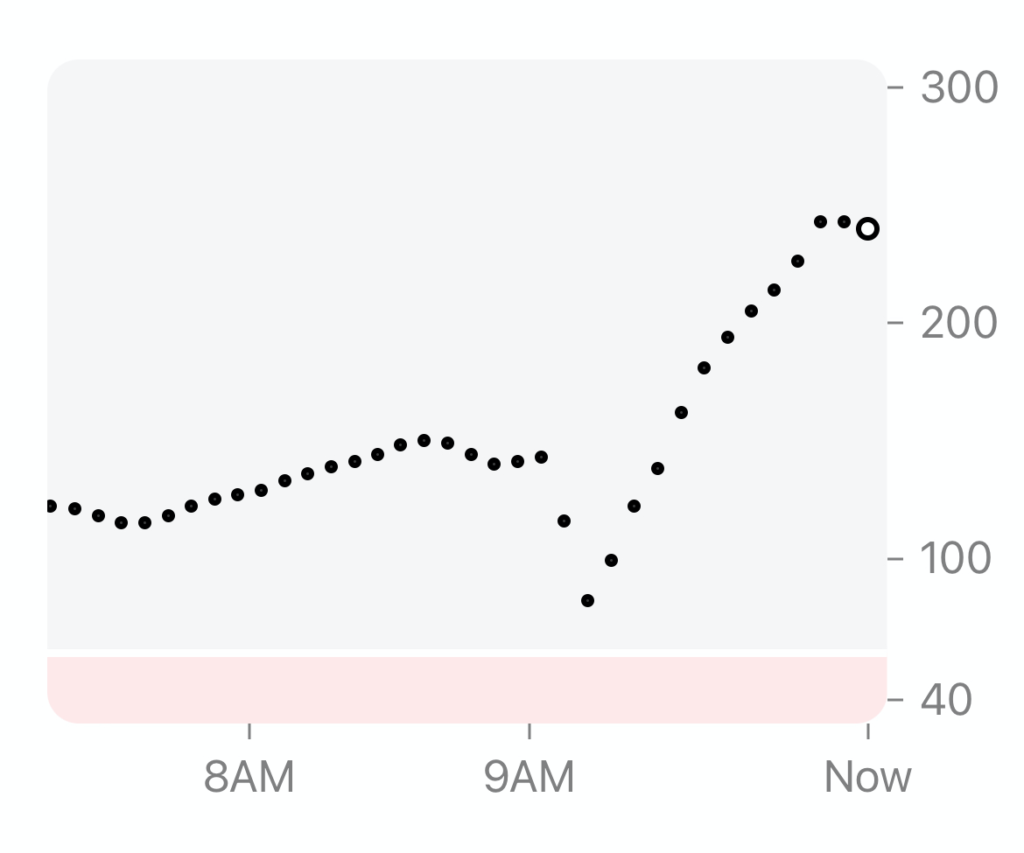
It was also a challenge on the blood sugar front. My Dexcom system gets a little cranky when it's cold out, so I knew the readings were to be taken with some skepticism. The precipitous drop you see below is almost certainly due to the cold impacting my sensor.

a graph of my continuous glucose monitor during my 5k race

Wheeeeeeee!

I knew the crazy spike was going to come when I stopped running as it happens after most workouts and seems to be proportional to my pace. I have to assume that running all out for 5k gets the liver a little revved up, dumping glucose (aka energy) into the blood stream because my muscles were screaming for fuel.

Frosty

It was in the low 40s this morning, which made for an exhilirating run, mostly in the dark. The upshot is that there is enough light now to get good morning shots.

Untitled

Above the Fog

On Sundays I take Posey for a hike in Upper Bidwell Park. It’s been foggy lately, as it usually happens during fall in the California Central Valley. It doesn’t take a lot of elevation to get above the fog and the park is perfect for this.

Photos from the Cyclone Bomb

We live on the Lindo Channel here in Chico, which is an overflow for Chico Creek. The channel doesn’t have water in it most of the time as it’s designed for, well…overflow. Overflow isn’t really something we deal with a lot here in droughty California. But, when the rain comes down this much, this quickly, overflow is exactly what you get.

A flooded Lindo Channel on a cloudy day.

The above photo doesn’t even capture the high water mark, but I get down there to take photos when I can, not when I want to.

Flood waters receding in the Lindo Channel at sunrise.

It’s going down pretty quickly, the photo above is roughly 24 hours later.

Just a trickle of water left.
Nothing but a few puddles and garbage left now.

iPhone Photo Breakdown

Since January 15, 2008 I've taken 18,784 photos with 7 different iPhone models.

  • iPhone 1 (1,486 over 1,482 days)
  • iPhone 3GS (2,186 over 670 days)
  • iPhone 4S (3,344 over 803 days)
  • iPhone 5S (3,051 over 751 days)
  • iPhone 6S (3,913 1,104 days)
  • iPhone 8+ (4,804 over 746 days)
  • iPhone 11 Pro Max (3,091 over 664 days [as of 08-07-21] and counting)

Generally I've taken more photos with each successive iPhone model, with a little lull at 5S and 6S. The 11 Pro Max is probably going to come in lower just due to COVID. We haven't travelled hardly at all and that tends to be when I add a good number of photos to the collection.

Graph showing that I generally take more iPhone photos as time goes on

I'm not sure if I think I've become a better photographer or if the camera technology just generates better photos, but over time the number of favorites has increased. Again, the 11 Pro Max is a COVID outlier.

Graph showing that I generally favorite more photos as time goes on

Not exactly riveting data analysis, but the air quality is crap today so I was stuck inside and this is all I could think up.

Update: Based on some feedback I have corrected the number formating and added the number of days I had each phone.

Amazon Order History

Amazon provides an Order History Export function and it will give you everything back to 2006 in a CSV download. I dumped that into a Google Sheet, did a quick pivot table to get orders by year...just because.

A graph showing that my Amazon order count has increased over time

Now, a few caveats...

  1. This is only orders on my account, not our total household orders.
  2. I would haven't to manually enter orders prior to 2006 and I'm pretty lazy, so that probably won't happen.
  3. I don't know why our orders exploded in 2011. I should probably look up some kind of Amazon Prime timeline to see what launched.
  4. I don't know what happened in 2017.