
I live across from the Lindo Channel, which is just a dry ditch most of the year. It's an overflow for Chico Creek, so the only time we have water running is when the city doesn't want downtown flooded. There is a tree in the middle of the channel and for some reason I started taking photos of it back in 2017 and since I'm a creature of habit I have continued to take photos. I miss days here and there, of course, but more often than not I get down there and grab my shots.

All of these photos are Attribution-NonCommercial-ShareAlike Creative Commons licensed. Maybe you will do something cool with them. If you're thinking hey, I know! I'll make a time lapse video! Well, good luck with that. These are handheld photos, so the tree is not exactly centered, much as I tried. So, there is tremendous jitter when you try to do things the "easy way", by which I mean just use ffmpeg to squish them in sequence into a video. The results are a bit...jarring.
Browse the entire collection of years if this suits your fancy!
Diabetes Daily has a nice list of sugar-free sweeteners and I would add Jordan's Skinny Syrups. I go for the mocha flavored since that was my go-to coffee drink prior to my diagnosis.
Type 1 Diabetes is an infuriating disease. The short version is that special cells in your pancreas stop producing insulin. Insulin is needed by your body to get glucose (energy) into your cells. Without insulin, glucose builds up in your bloodstream and does terrible things. Without insulin, your body starts to starve and you die. Before 1921, when insulin was first isolated and used as a medication, type 1 diabetes was a death sentence. The long version is you become an endocrinologist. If medical schools seems like more than your want to take on, a dive down the Wikipedia type 1 rabbit hole will probably fill many of the gaps I’ve left.
The more you read about type 1 the more you’ll hear about the challenges and uncertainty that we face. We’re always searching for “the answer”, the one true way that’s sure to keep our blood sugar steady and in range, with minimal effort of course! The more you search, the more you’ll find that there is no one true way and trying to nail down controlling type 1 is like trying to nail jello to a wall. It’s hard work and the only way to stay healthy is to do the work. Every day, all day.
While everybody with type 1 has to deal with it differently, we all have the same tool set to work with: exercise, diet, medication, and data. I list these in the order that I feel they’re accessible (read: affordable). Exercise is almost universally accessible, in one form or another, while the data from a continuous glucose monitor (CGM) can be prohibitively expensive. If you’re wondering why diet isn’t as accessible as exercise, next time you go shopping, try to buy all fresh, non-processed foods with minimal carbs/sugar. Your bill will almost certainly be much higher than average. Medication, mostly insulin, depending on your insurance can be reasonable or making you wonder if you should eat or refill your prescription. Too many people have to make a choice of one or the other.
This is the beginning of me writing about my adventures with type 1 diabetes. This isn’t advice, just anecdotes from my life about how I do my best to manage this chronic disease. What works for me may very well not work for you and visa versa. Caffeine may not spike your blood sugar like it does mine! The variations are seemingly infinite, but it does boil down to 42 factors.
To start, I’ll briefly run through the tools as I use them and maybe they’ll give you some ideas on how you can adapt these tools to your life. As I continue to add to my adventures we’ll get deeper into each area. Standard disclaimer that you should talk to your doctor about what you plan to change in your self-treatment practices. I can promise you one thing, whatever I’m doing won’t work the same way for you. Because diabetes is a jerk.
I pretty much only have two routines: walking or running. I know, I should throw in other things like core workouts, biking, swimming, or, you know…literally anything else. But this is what I can fit into my life right now.
Exercise has a dramatic impact on my blood sugar and insulin sensitivity. That dramatic impact can be in both directions, because diabetes is a jerk. The longer the distance or more intensity to run, the more there will be a blood sugar bump after I finish the workout. I assume this is because my liver is working full time dumping glucose into my bloodstream to power my muscles and when I stop using my muscles the glucose just piles up in my blood.
On the insulin sensitivity front, I have to be very, very careful while I’m out walking or running. I rarely try to never go anywhere without glucose tabs, but for my longer runs (10+ miles) I have to carry a lot of snacks. Currently I’m using SuperFat and Verb energy bars. Occasionally I’ll use some UCAN Super Starch before I head out.
I’ve settled on a very low carbohydrate diet. Some might call it Keto, but I’m not aiming for a state of ketosis, just strictly limiting my carbohydrate intake. Gone are the dinners with pasta and bread. Protein and fat are my macro nutrients of choice. I do allow myself one or two “glucose excursions” (a phrase I borrowed from Peter Attia) .
I’m fairly bland here, I have two types of insulin, fast acting and long acting. Fast acting I take prior to eating or to control any elevation in blood sugar during the day. I take the long acting when I go to sleep for better overnight control. I'm a fan of the "kwik pen" style and have never used a real syringe or insulin from a vial. I've also never used an insulin pump and plan to stuck with multiple daily injections for the forseable future. From the book Dr. Bernstein’s Diabetes Solution, I use The Law of Small Numbers, which is that fewer grams of carbs means fewer units of insulin I need to inject. It also helps to “flatten the curve” of my blood sugar, avoiding peaks and valleys on my Dexcom continuous glucose monitoring (CGM) graph.
Speaking of CGM, I’m fortunate to have coverage for the Dexcom G6. It provides me with near real-time readings 24/7, with the small exception of the two hours a new sensor takes to warm up after I put it on. Before the Dexcom I was limited to only getting readings when I did a finger stick. Doing this more than 6 times a day and trying to do it at night was doable, but having a system where the measurements just happen is an absolute game changer. A finger stick will get you a point in time reading. If you want a trend you need multiple readings, which means multiple sticks. While you get used to piercing your skin to draw blood, I don’t think it ever gets comfortable. Or maybe I just have really sensitive fingers. Regardless, having a reading every 5 minutes from the Dexcom has made managing my blood sugar easier, but still not easy. Because diabetes is a jerk.
I hope this has been helpful, even though I’ve barely scratched the surface. There are so many sources of information, and I’ll try and highlight as many of the ones that I trust as I can in the future. I don’t do comments here, because the internet can be a very horrible place, so if you would like to reach out I’m @pberry on Twitter or you can email me at pberry @ gmail . com.
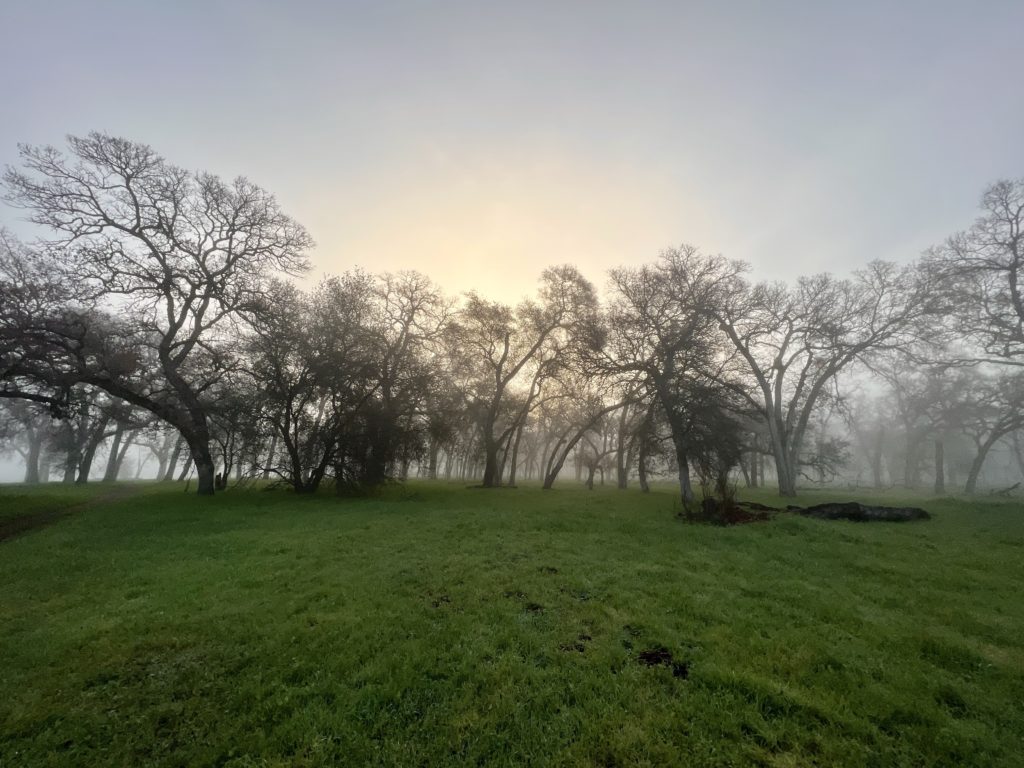
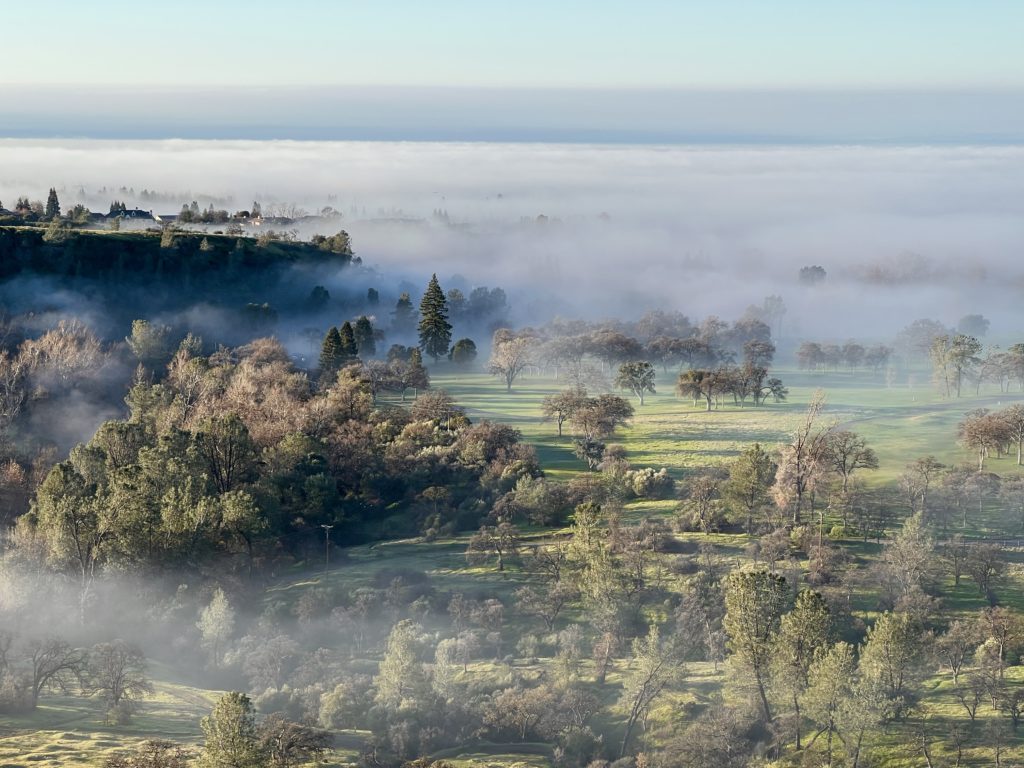
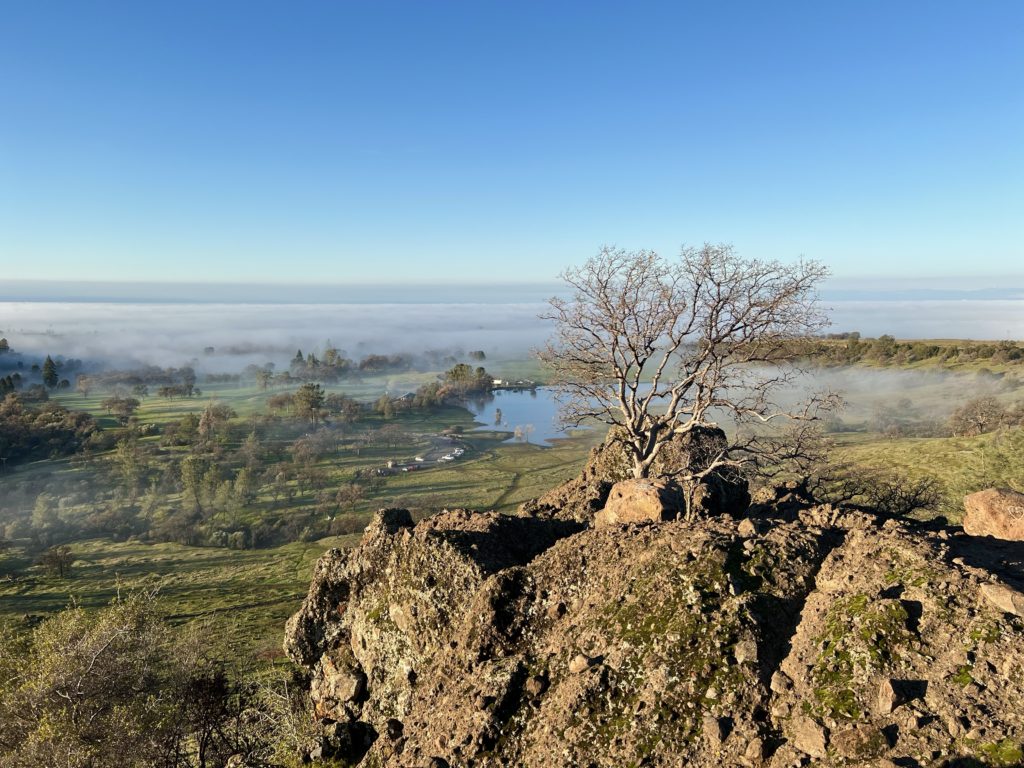
There have been a lot of dense fog advisories in the northern California valley recently, which is quite typical for this time of year. It can make for some great sunrises if you can get just a little bit of elevation.

I also ran by some deer that were having a lovely breakfast stroll on Upper Trail.

This was all on my standard weekend long run.
Run for Food was back on this year. It certainly wasn't up to the same level of participation that it has had in the past, but it was a good showing. I opted for a chipped time even though I haven't been doing anything that would suggest I would have a fast time. I did manage a 7:49min/mile page, which I guess for not going in with a goal is a fine after the fact one. Total time was 00:24:13, 7th in my age group and 96th overall (race results).
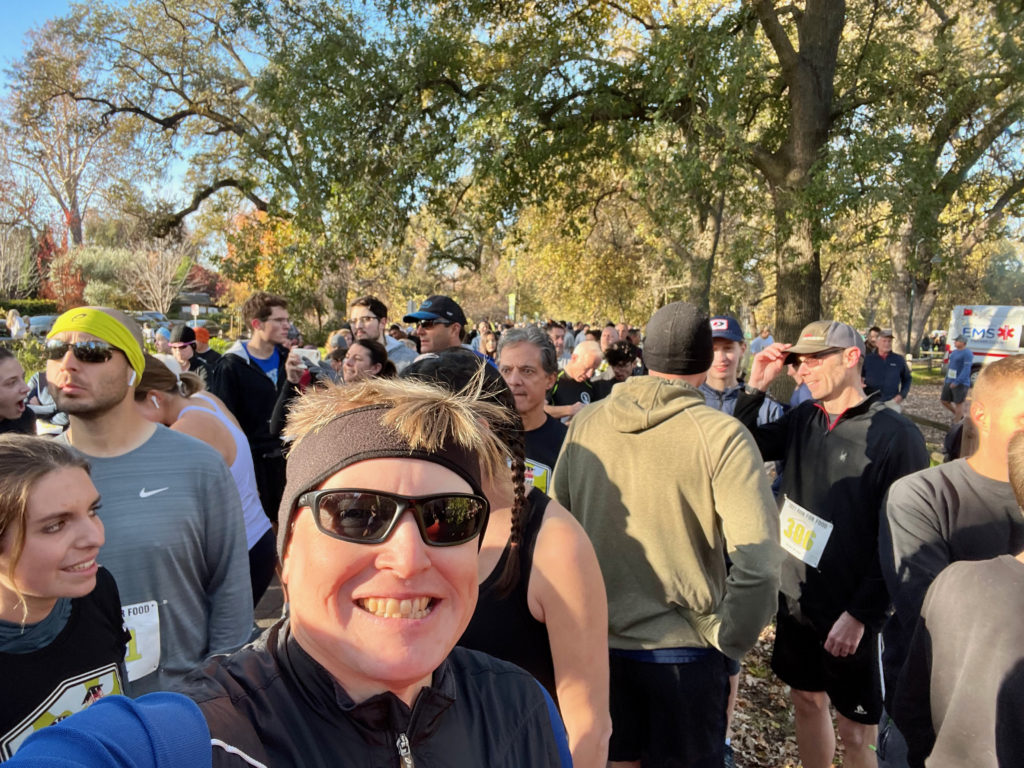
My race nemesis, Ben Bailey, caught up to me with about half a mile to go. He then proceeded to pull away and there wasn't a damn thing I could do. I was going as fast as I could go and there was nothing in the tank.

What ruggedly handsome runners!
It was also a challenge on the blood sugar front. My Dexcom system gets a little cranky when it's cold out, so I knew the readings were to be taken with some skepticism. The precipitous drop you see below is almost certainly due to the cold impacting my sensor.
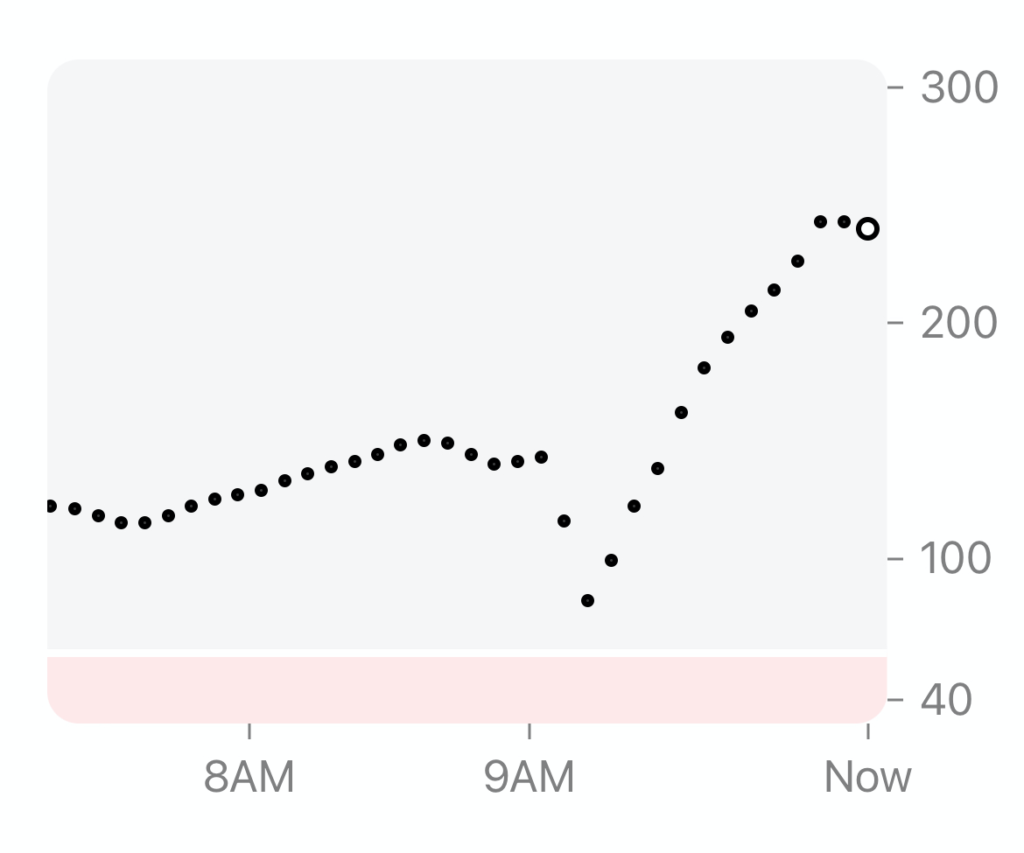
Wheeeeeeee!
I knew the crazy spike was going to come when I stopped running as it happens after most workouts and seems to be proportional to my pace. I have to assume that running all out for 5k gets the liver a little revved up, dumping glucose (aka energy) into the blood stream because my muscles were screaming for fuel.
No, I’m not shopping today. It was a gorgeous day for a hike in the park though!


It was in the low 40s this morning, which made for an exhilirating run, mostly in the dark. The upshot is that there is enough light now to get good morning shots.

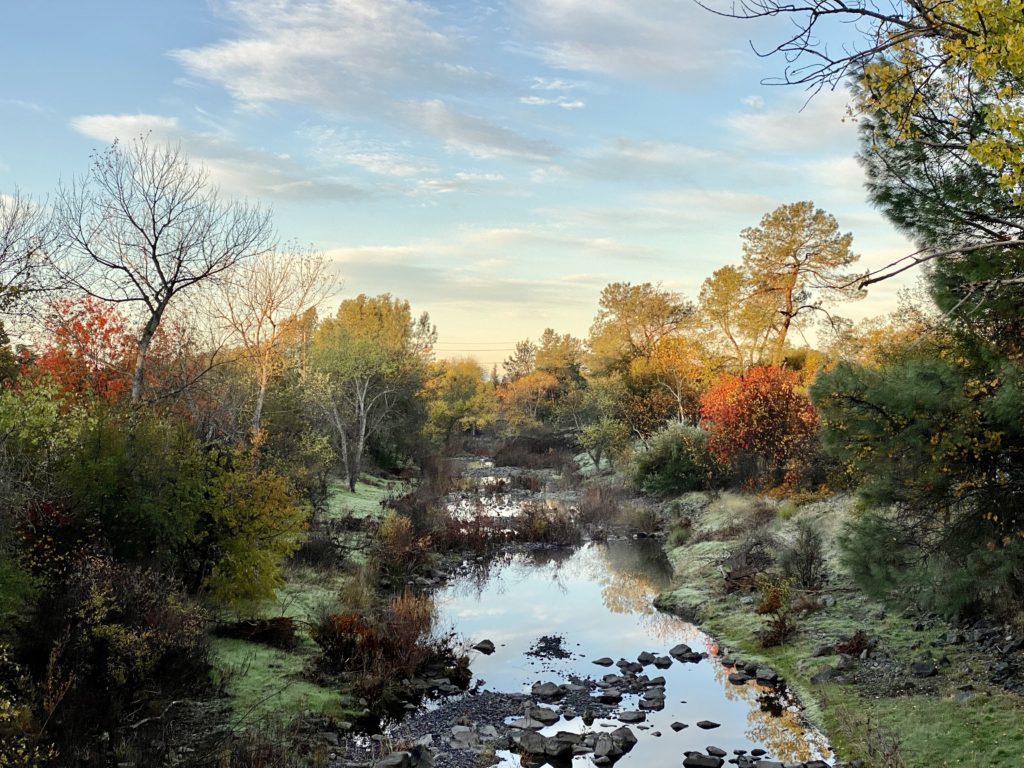
Taken during my run this morning. My timing was impeccable. You can get a larger resolution at Flickr.
I've updated my Lindo Channel albums on Flickr and they're broken down by year. They are Creative Commons Attribution-NonCommercial-ShareAlike licensed. Maybe you'll be more creative with them than I have been. Let me know if you do something cool with them. @pberry, Instagram, or same username @ gmail.com.


